Understanding NFL media markets by TV households is crucial for grasping how the league’s economics, broadcasting deals, and team valuations work.
Television viewership has a direct impact on everything from advertising revenue to ticket sales, making market size one of the most crucial factors in professional football.
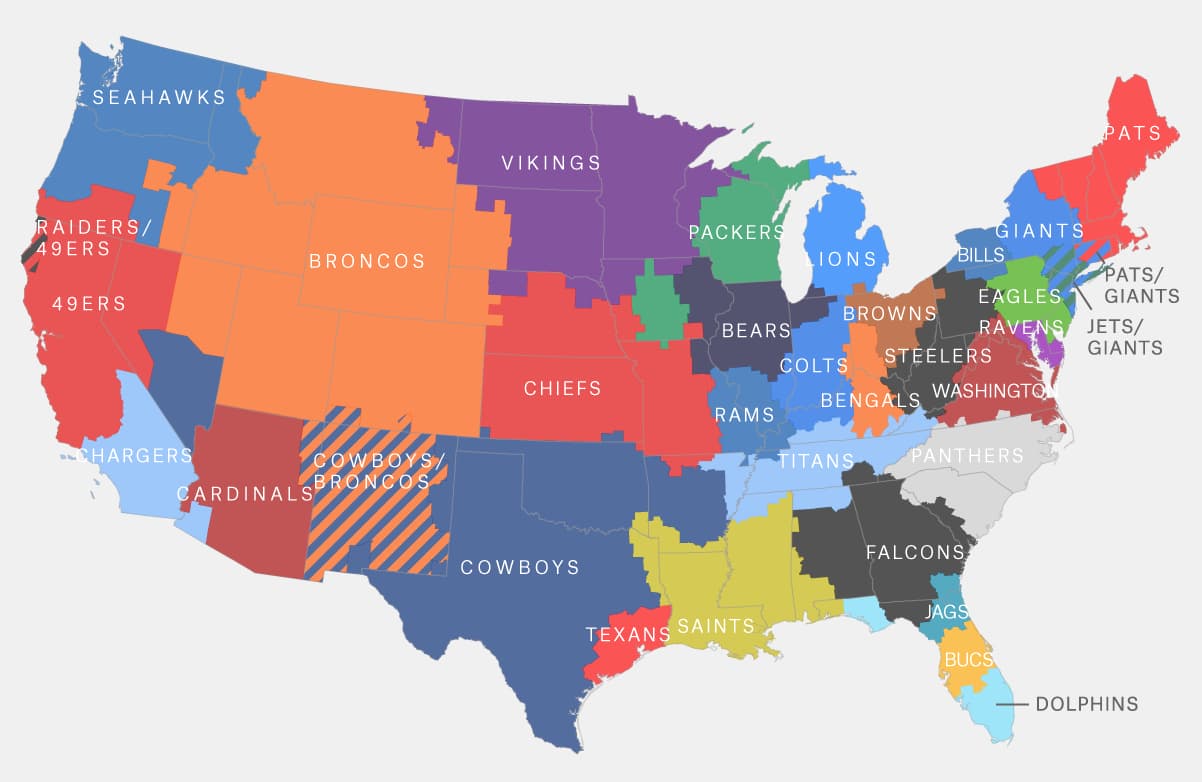
The NFL’s 32 teams are spread across media markets of vastly different sizes.
Some teams, like the New York Giants and Jets, compete in a massive market with over 7 million TV households, while others, like the Green Bay Packers, thrive in a smaller market with fewer than 500,000 households.
These differences significantly influence team revenue, broadcast exposure, and regional popularity.
Media market rankings are determined by Nielsen ratings, which measure the number of TV households in each designated market area (DMA).
Larger markets typically generate more local broadcasting revenue, attract bigger sponsorship deals, and have greater potential fan bases.
However, smaller market teams often cultivate incredibly loyal fanbases that punch above their weight in merchandise sales and national viewership.
Whether you’re a sports business analyst, fantasy football enthusiast, or just curious about how the NFL operates behind the scenes, understanding these market sizes provides valuable insight.
NFL Media Markets by TV Households
Let’s explore how all 32 NFL teams rank by their television household markets!
NFL Media Markets by TV Households
Ranked by TV Households (2024-2025 Season)
| Rank | Media Market | TV Households | Teams |
|---|---|---|---|
| 1 | New York City | 7.453M | GIANTS, JETS |
| 2 | Los Angeles | 5.735M | RAMS, CHARGERS |
| 3 | Chicago | 3.472M | BEARS |
| 4 | Philadelphia | 2.997M | EAGLES |
| 5 | Dallas-Ft. Worth | 2.963M | COWBOYS |
| 6 | San Francisco-Oakland-San Jose | 2.653M | 49ERS |
| 7 | Atlanta | 2.649M | FALCONS |
| 8 | Houston | 2.570M | TEXANS |
| 9 | Washington, DC (Hagrstwn) | 2.566M | COMMANDERS |
| 10 | Boston (Manchester) | 2.490M | PATRIOTS |
| 11 | Phoenix (Prescott) | 2.158M | CARDINALS |
| 12 | Seattle-Tacoma | 2.099M | SEAHAWKS |
| 13 | Tampa-St. Pete (Sarasota) | 2.035M | BUCCANEERS |
| 14 | Minneapolis-St. Paul | 1.887M | VIKINGS |
| 15 | Detroit | 1.863M | LIONS |
| 16 | Denver | 1.798M | BRONCOS |
| 18 | Miami-Ft. Lauderdale | 1.693M | DOLPHINS |
| 19 | Cleveland-Akron (Canton) | 1.512M | BROWNS |
| 22 | Charlotte | 1.291M | PANTHERS |
| 25 | Indianapolis | 1.183M | COLTS |
| 26 | Pittsburgh | 1.166M | STEELERS |
| 28 | Baltimore | 1.130M | RAVENS |
| 29 | Nashville | 1.102M | TITANS |
| 34 | Kansas City | 986K | CHIEFS |
| 36 | Cincinnati | 926K | BENGALS |
| 37 | Milwaukee | 922K | PACKERS |
| 40 | Las Vegas | 834K | RAIDERS |
| 43 | Jacksonville | 757K | JAGUARS |
| 50 | New Orleans | 664K | SAINTS |
| 54 | Buffalo, NY | 613K | BILLS |
| 69 | Green Bay-Appleton | 456K | PACKERS |
Conclusion:
This comprehensive breakdown of NFL media markets by TV households reveals the massive differences in market sizes across the league.
From New York’s 7.4 million households to Green Bay’s 456,000, these numbers tell an important story about the NFL’s economic landscape.
What’s fascinating is that market size doesn’t always determine success.
The Green Bay Packers, despite having one of the smallest media markets, remain one of the most valuable and popular franchises in the entire league.
Their community ownership model and rich history prove that passionate fanbases can overcome market size disadvantages.
Similarly, the Pittsburgh Steelers and New Orleans Saints have built national followings that extend far beyond their local markets.
However, large market teams do enjoy significant advantages in local broadcasting revenue, sponsorship opportunities, and potential fan base growth.
Teams in New York, Los Angeles, and Chicago can leverage their massive populations for increased revenue streams that smaller market teams simply cannot match.
Understanding these market dynamics helps explain why certain teams command higher valuations, why broadcasting rights are so valuable, and how the NFL’s revenue sharing model attempts to level the playing field.
Whether you’re analyzing team finances or simply curious about the business of football, TV household numbers provide essential context for the modern NFL landscape!
Also Check: Official NFL Team Names in Alphabetical Order